The average American produces more than 4 pounds of trash per day. Think about that for a second: every single day! The majority of that trash gets compacted in landfills, then often bulldozed and buried — and there it sits. Meanwhile, it breaks down, rots, and leaches chemicals into the soil it’s sitting on or surrounded by and it accumulates.
This got us wondering about the way Americans treat our trash. We wondered about the garbage in our own backyards, so to speak, and in backyards across America. Where are the landfills in our state and all the others? Are they open or closed? What kind of trash do they accept? Does our trash stay in our own states, or does it get trucked to somewhere else — and why? All told, trash disposal is a much more complicated process than one might think.
In pondering the cycle of refuse, we consulted the EPA’s Greenhouse Gas Reporting System to get a handle on the amount of per capita waste that exists in (or gets transferred to) each state, then gathered information about where, what kind, and how much, and what happens to it all. Here are some of the trashy takeaways we came up with:
- The average American produces 4.5 pounds of waste every single day.
- The amount of trash going into the country’s landfills is at its lowest level since 1960.
- Food waste, plastics, and paper products make up more than half the garbage in U.S. landfills.
- Michigan is the state with the most trash per capita, with Indiana and Illinois ranking second and third.
- Indiana’s landfills are growing the fastest in the nation.
- California has more landfills than any other state in the nation — more than twice as many, in fact, as every other state except Texas.
Garbage is filthy but fascinating. The things we throw away (and how we do it) can tell us so much about ourselves as a people: what we keep, what we throw out, how much thought we give to the process, whether — and how — we can try to make it better.
So let’s get our hands dirty by digging into more facts about the nation’s trash.
Our Daily Trash
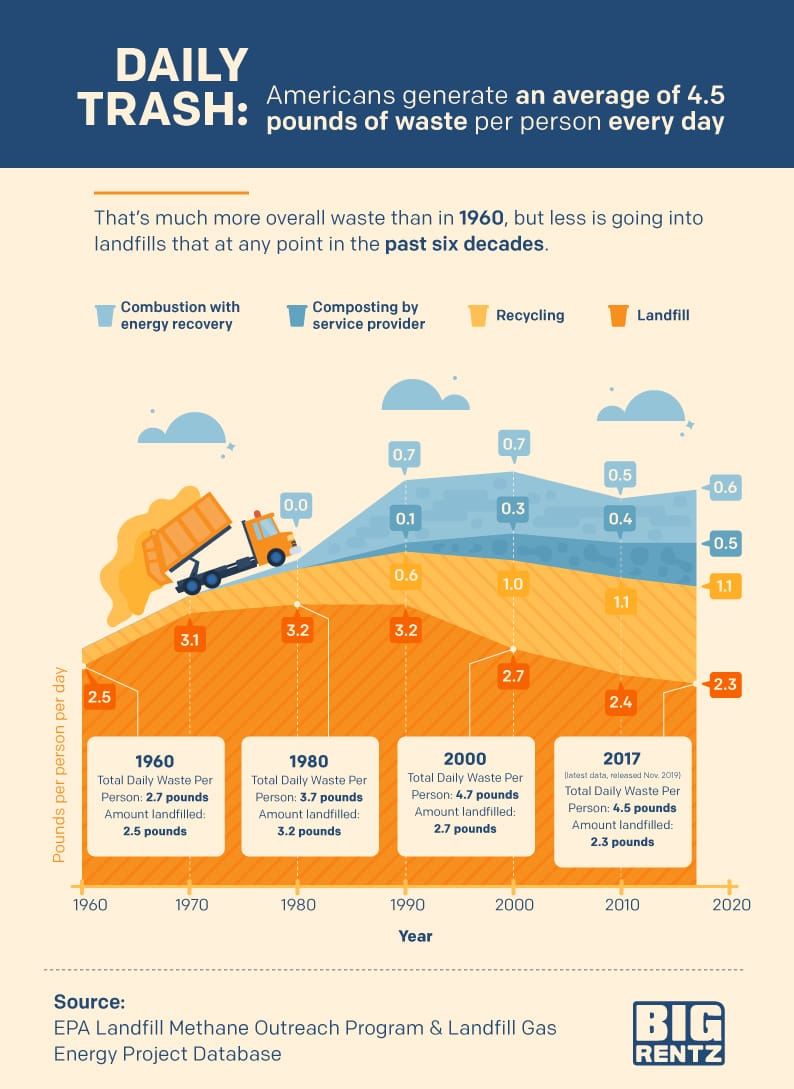
The typical American produces an average of 4.5 pounds of waste every single day. That’s 1,642.5 pounds a year for each man, woman, and child in the United States. To put that into perspective, it’s nearly as heavy as two horses, or almost half the weight of a 2009 Ford Taurus. That’s a lot of weight!
A lot of the trash we produce goes into landfills. But the good news is that the annual amount of trash deposited in landfills has actually fallen through the years. Even though the total amount of waste we produce has increased substantially over the past three generations, the amount of trash going into landfills today is at its lowest level since 1960. America is currently landfilling 2.3 pounds of waste per person daily, whereas in 1960, the rate was 2.5 pounds per person daily.
Recycling, burning, and composting are helping restrict landfill growth, especially with curbside programs and cash-back initiatives. In California, for instance, consumers pay an extra 5 or 10 cents for a drink, depending on the size of each beverage container they purchase, then get a refund when they drop off the empties at recycling centers. Californians have recycled more than 300 billion aluminum, glass, and plastic containers since the program started in 1987. And the Golden State isn’t alone: A total of 1.2 billion aluminum cans were collected and recycled across the United States in 1972, a figure which rose to 62 billion cans recycled by 1995.
However, there are still no nationwide recycling requirements, and only 22 U.S. states have mandatory recycling laws. So the problem isn’t solved — far from it. Think of it like the national debt: It keeps rising, even if the deficit gets lower year after year. In the same way, the amount of trash in landfills keeps increasing, even if we’re recycling and composting a higher percentage of it.
That’s because we’re now producing far more waste than we were when Elvis topped the charts: 4.5 pounds of trash daily per person in 2017, a nearly 70% increase from the tally of 2.7 pounds in 1960. The disposal difference lies in the fact that back then, 92% of that waste was carted off to landfills, compared to 51% three years ago.
Programs to curb the use of polystyrene foam containers, plastic straws, and plastic grocery bags have helped immensely in curbing the landfilled total. But still, day after day, truckload by truckload, layer upon layer, all of that garbage adds up.
Waste in Place
Chances are, the soup can your great-grandmother threw away three generations ago is still in a landfill somewhere. Decades’ worth of trash is buried in landfills across the country, and some of it has been shipped from one state to another. Learning this strange fact led us to wonder: Which states contain the most trash in landfills per capita?

Upper Midwestern and eastern industrial states especially have racked up a lot of trash over the years, with Michigan, Indiana, Illinois, Pennsylvania, and Ohio taking the top five spots on the trash-per-capita list. More sparsely populated states such as Wyoming, Idaho, Maine, Vermont, and North and South Dakota, all rank among the 10 states with the least landfill trash per resident.
Michigan has the most accumulated “waste in place” per person, with a staggering 62.4 tons of buried waste for every man, woman, and child in the state. Indiana and Illinois rank second and third, with 56.1 and 52.4 tons of trash per capita, respectively.
Largely because it accepts considerably less trash by volume than most other states, Connecticut hosts the least buried trash per person, with only 8.7 tons per resident. Massachusetts (16.2 tons) and Wyoming (16.6 tons) rank second and third least landfilled, respectively.
New Landfill Waste
Some states are accumulating new landfill waste faster than others. Again, upper Midwestern states have some of the highest accumulation rates, indicating that they don’t just contain the most landfill trash, but they’re also adding to those landfills faster than other states. Indiana, Michigan, Ohio, and Illinois all rank in the top five for new landfill waste per capita, joined this time by Colorado.

Indiana leads the nation with an annual “landfill waste acceptance rate” of 2.35 tons per year per resident. Michigan and Colorado follow with annual new landfill waste equivalent to 2.27 tons and 2.06 tons per resident, respectively. (NOTE: This includes waste from industry and trash imported from other states.)
Connecticut is accumulating the smallest volume of new landfill trash annually. Its “landfill waste acceptance rate” is 0.41 tons per person (or less than 10% of the daily amount of trash produced).
Anatomy of a Landfill
So, what’s in a landfill? A lot of different stuff. But three categories — food waste, plastics and paper products — account for more than half the garbage accumulated underground.
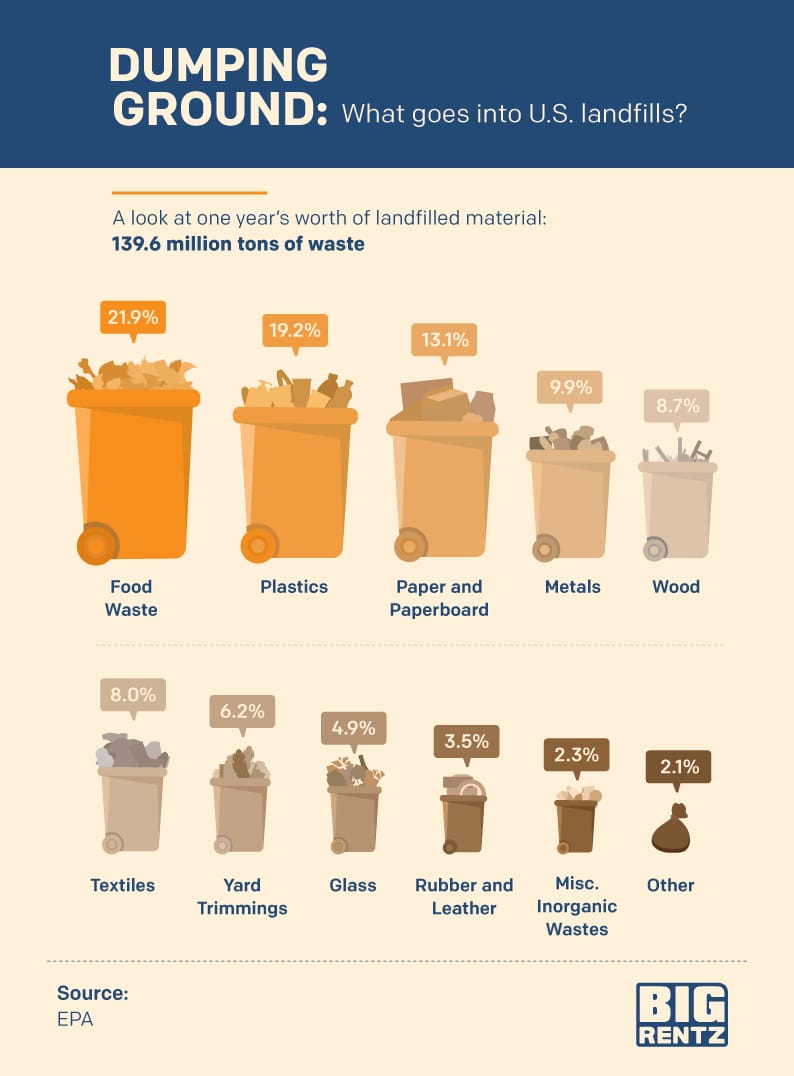
Topping the list of landfill ingredients at 21.9% is food waste: the supersized burger you couldn’t finish or those leftovers you socked away in the fridge and never ate.
Checking in at No. 2 with 19.2% in American landfills are plastics: bags, straws, plastic wrap, water and milk bottles, and their lids. These don’t just end up in landfills, either; a lot of this stuff gets dumped into the ocean. On the third Saturday of September 2018, a total of 800,000 volunteers collected more than 20.5 million pounds of trash during Coastal Cleanup Day. Among the haul were more than 286,000 plastic bottle caps, 242,000 plastic beverage bottles, 144,000 straws and stirrers, and nearly 97,000 plastic grocery bags.
Rounding out the top three U.S. landfill ingredients at 13.1% are paper products: newspapers, phonebooks, cardboard boxes, and office paper.
Metals, wood, textiles, and yard trimmings each made up more than 5% of the total.
How long does it take garbage to decompose?
While we pondered what goes into an average American landfill, we also wondered about the way it goes out (or if it ever does): How well does the trash in a landfill decompose, and how long does each type take?

Biodegradable items like paper, food, and cardboard take only weeks or months to decompose. In the middle of the timeline, human-made materials like plastic bags, styrofoam cups, and tin cans take multiple decades. At the far end of the spectrum, PVC plastic (like the kind used in credit cards) takes 1,000 years to break down, and glass takes 1 million years.
NOTE: These are average decomposition times, and so are approximate. Factors like moisture, temperature, sunlight, atmospheric conditions, and altitude can influence decomposition rates. Landfills are designed to store trash, not help it decompose; in fact, their design often makes decomposition harder. Modern landfills are lined with clay and plastic to keep waste from leaching into soil and groundwater. Trash is typically compacted, so there is not much air. And waste is often covered with a layer of soil to reduce odor, which blocks sunlight.
A Look at the Landfill Landscape
How many landfills are there across the United States? There are currently 2,622 in existence; of those, 1,304 are open and operating. We looked at how and where those numbers break down.

California, Texas, and Kansas have the most operating landfills, rankings which partially correspond with the states’ relative size and populations.
California, with 118 working landfills, has more than twice as many as any other state, except for second-ranked Texas. The Golden State also has by far the most closed landfills, 176.
Significantly smaller states Connecticut, Vermont, and Rhode Island have the fewest operating landfills. Almost all of Connecticut’s landfills have been closed.
Whose Trash Is It?
Although local governments still own most of the country’s landfills (1,669 out of 2,622), about one-third of landfills today are privately owned (860 out of 2,622). Others are operated as public/private partnerships.

Michigan leads the nation with the greatest percentage of privatized landfills (81.7%), followed by Illinois (79.1%) and Pennsylvania (76.8%). Wyoming, South Dakota, and Delaware do not house any private landfills. New Hampshire, Hawaii, and Utah have the lowest percentages of private landfills in the country. Regardless of ownership type, all landfills in the U.S. are monitored by the Environmental Protection Agency.
According to one estimate, private industry controlled 85-90% of permitted landfill capacity as of 2018, a sharp rise from 36% just 20 years earlier in 1998, and just 17% in 1984. Private companies have better access to private funding and can benefit from economies of scale.
And they have plenty of incentive to get involved. Private landfills are big business: Five publicly traded companies ran 542 active landfills in North America as of March 2019. The biggest of the firms, Waste Management, ran 247 solid-waste landfills and five more for hazardous waste, employing 43,700 workers.
How Trashy is Your State?
Landfills take up a lot of space. For example, the largest landfill in the country, the West Miramar facility in San Diego, covers 1,388 acres. The second-largest, the Denver Arapahoe Disposal Site in Colorado, spans 1,363 acres. We looked at which states are using the greatest percentage of their land for landfills.

Our research found a tricky balancing act in these numbers: States that are smaller by area have less square mileage to spare, so their percentages may be predictably higher. Many Northeastern states also have a greater population density, augmenting the amount of trash produced. Consequently, with just over .0421% of its 8,729 square miles designated for landfill use, New Jersey has the greatest percentage of landfill space per square mile. Delaware and Rhode Island followed just behind.
Conversely, the states with the lowest populations and lots of open territory, Alaska, Montana, and Wyoming fell lowest in the ranking. And despite also having large geographic areas, more populous states like Florida ranked 8th, California ranked 11th, and Texas ranked 20th for landfill space per square mile.
The Shortfalls of Landfills
So what’s wrong with landfills? For one thing, in 1988, the EPA found that all landfills eventually leak, potentially discharging waste and toxins into the groundwater system. And that’s not to mention the smell.
If you think vehicle exhaust is the only source of climate change, think again. Landfills are a major source of methane, a greenhouse gas more than 80 times more powerful than carbon dioxide in destabilizing the environment. In 2017, the EPA reported that municipal solid waste landfills were the third-largest source of human-related methane emissions in the U.S., at 14.1%.
Is it possible to reach a point where no waste at all ends up in a landfill? The city of San Francisco thinks so, and has launched a zero-waste initiative to work toward that goal. According to the city’s Department for the Environment, “products should be designed and used according to a waste reduction hierarchy (prevent waste, reduce and reuse first, then recycle and compost).”
San Francisco has already exceeded its goal of 75% diversion from landfill and incineration, thanks in part to its “three-bin” waste system, under which residents and businesses sort trash into a green bin for compostable material, a blue bin for recyclables, and a black bin for landfill material.
So, there is hope. But there’s also a challenge. How’s your state doing? Hopefully, this survey has given you an idea of where we are and how far we have to go.
Methodology
The Environmental Protection Agency has been monitoring landfills and reporting data about the national waste stream for more than 30 years. All landfills, whether they are publicly or privately owned, are monitored as part of an effort to protect groundwater and track heat-trapping methane emissions.
For this project, we analyzed data from the EPA’s Landfill Methane Outreach Program and Landfill Gas Energy Project Database. The data we used was published in December 2019 and covered materials collected through 2017. Weights are in American “short tons,” which are equivalent to 2,000 pounds. For per capita calculations, we used U.S. Census Bureau population estimates from July 2019. For the graphic titled “What Percent of Your State is a Landfill?” we converted reported acres of landfills into square miles (640 acres make up a square mile) and used Department of Commerce and Census Bureau MAF/TIGER database figures for state area measurements.
Fair Use
Are you a journalist or blogger interested in covering this project? You don’t need to root through the rubble in order to reproduce any of the assets above for noncommercial purposes. All we ask is that you credit the authors appropriately and link back to this page so your readers can learn more about the study and its methodology.